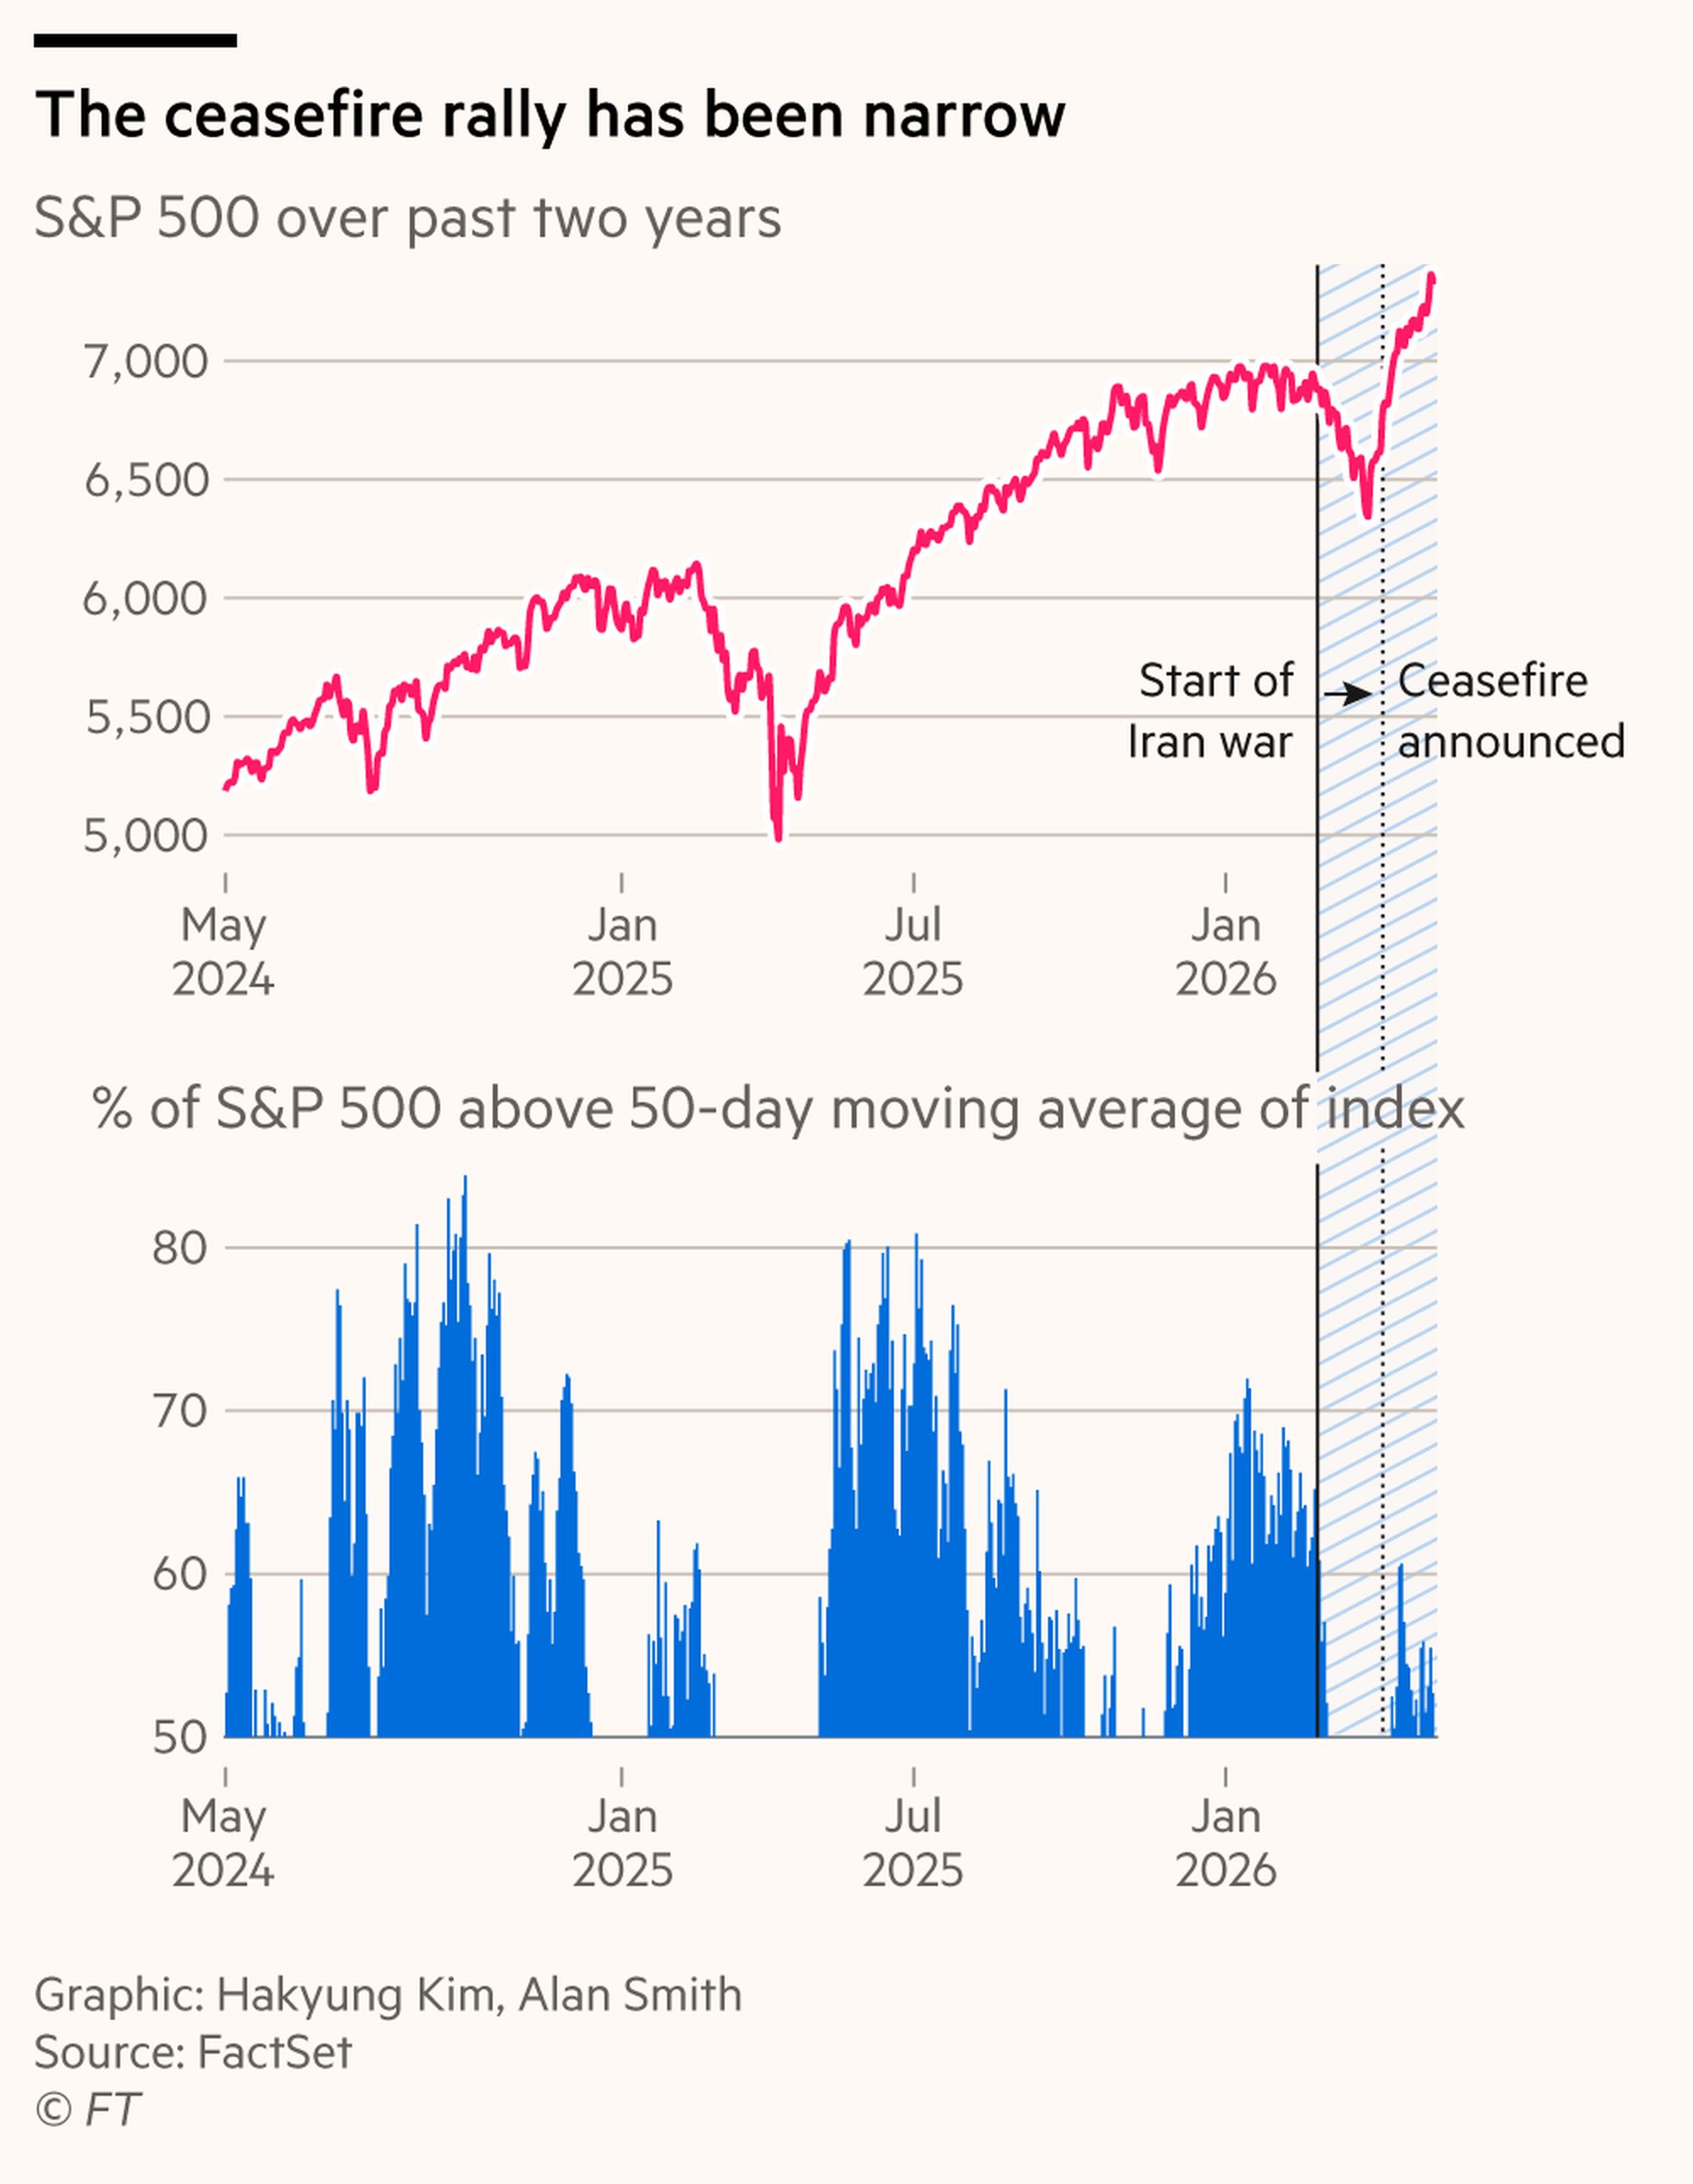
Good morning. The stock market has rebounded, and then some, since its wartime low on March 30, with the S&P 500 surging about 16 per cent. But market participation in the rally is low compared to prior rallies, such as the post-“liberation day” recovery last year. This is visible in the low proportion of S&P 500 members trading above their 50-day moving average. Just over half of the index is currently above its 50-day moving average; the level topped 80 per cent during the post-“liberation day” recovery last year.
您已阅读35%(698字),剩余65%(1285字)包含更多重要信息,订阅以继续探索完整内容,并享受更多专属服务。